

|
|
|
|
|
|
|
|
|
|
|
|
|
|
|
|
|
|
|
T-6 PERFORMANCE
By PAUL BIKLE
(Soaring October 1970 page 25-30)
Provide by Mike Thompson
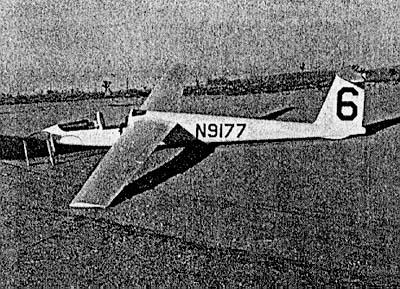
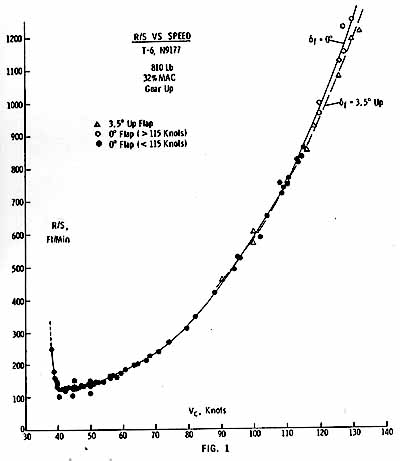
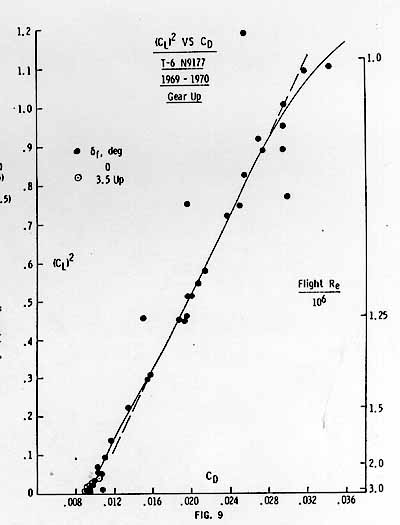
Much of the performance flight-test data measured on the T-6 sailplane has been included in previous portions of this series in the discussions of test procedures, data reduction, and as a basis for comparison tests with other sailplanes. Generally this data pertained to flight with zero flaps and to speeds under 110 knots. All test points have been plotted in Figs. I & 2 as rate-of-sink (R/S) and calibrated airspeed for sea level standard conditions. Zero flap points already shown in previous plots are included in Fig. 1 along with additional points at both zero flap and with 3.5-degree up flap obtained at higher speeds up to 130 knots. Although there is some improvement in performance with 3.5 degree up flap at 120 and 130 knots, this improved performance exists only at speeds of limited interest for most soaring flights.
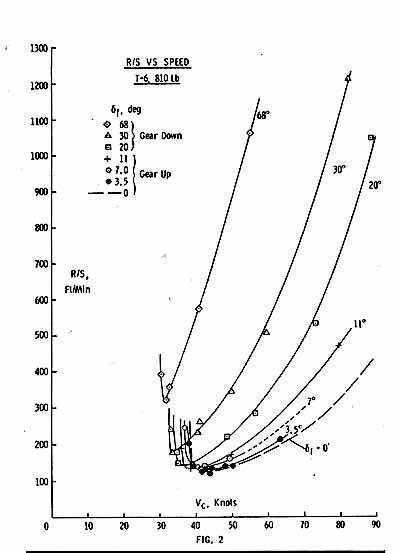
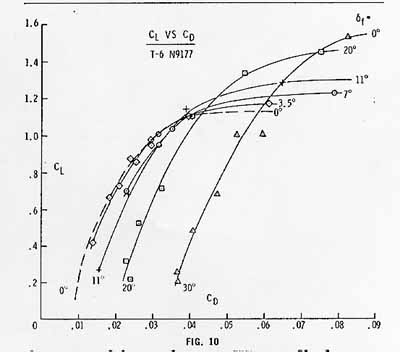
Performance for flap settings of 3.5, 7.0, 11.0, 20, 30 and 68 degrees down is shown in Fig. 2. In no case is the minimum rate-of-sink reduced below that obtainable with the zero flap setting. Moderate use of flap does make available a reduction in stalling speed for use in tight thermals with, only a moderate increase in sinking speed. In practice, this has been of limited value because normal maneuvering in thermals results in departures from the optimum part of the curve for each flap setting sufficient to raise the average rate-of-sink to an unacceptable level; in most cases it is more advantageous to use zero flap, a higher speed and a wider turning radius in any but the tightest thermals.
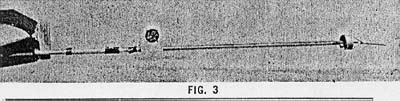
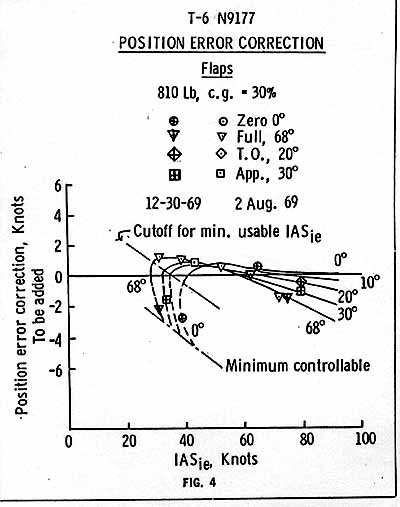
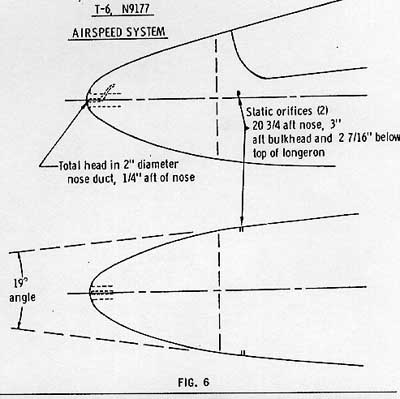
Airspeed system error calibrations have been mentioned in earlier parts of this series, and a correction curve has been shown for the zero-degree flap case. Use, of the test swivel pitot-static lead on a wing boom, Fig. 3, for comparison with the T-6 airspeed system facilitated calibration of the system and made it possible to define the corrections required down to speeds well into the stall for flap settings of interest as plotted in Fig. 4. Note hat, as the T-6 begins to stall, the system errors start to make the airspeed read high and, in flight, one observes the indicated airspeeds start to increase before the minimum speed is reached. Calibrated stall speeds and lift coefficients corresponding to these speeds are plotted as a function of flap setting in Fig. 5. For all normal soaring and other flight conditions such as landing, the system corrections are less than one knot and the system is considered one of the better flush static systems. Details of the location of the total pressure probe and the static orifices on the T-6 appear in Fig. 6.
Determination of angle of attack or relative air flow is one of the more difficult measurements if it is to be done with the precision required to be of use to the aerodynamicist. An overall accuracy in the neighborhood of one-quarter of a degree is required for this purpose; even greater accuracy would be required if angle-of-attack measurements were used in a direct measure of glide angle as has been suggested by several experimenters, where angles would have to be accurate to about 2 or 3 minutes or about 1/25 of a degree.
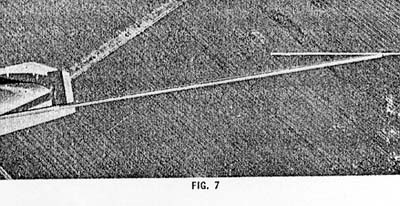
We first attempted to measure the relative air flow directly. Fig. 7 shows a flight photo of a 28-inch piece of yarn attached to the front end of a wing boom two chord lengths ahead of the wing at the mid semi-span and displaced 9" to one side of the boom. The angle was read directly by visually aligning the yarn with radial lines on a calibrated scale on the, canopy referenced to the zero angle of attack line for the sailplane. This approach eliminated any corrections for wing twist or boom bending but still required correction for upwash and a small correction for yarn droop due to gravity. Readings were consistent to about 1/4 degree but the overall accuracy was felt to be only about 1/2 degree because of the magnitude of the upwash corrections which exceeded one degree at the slower speeds.
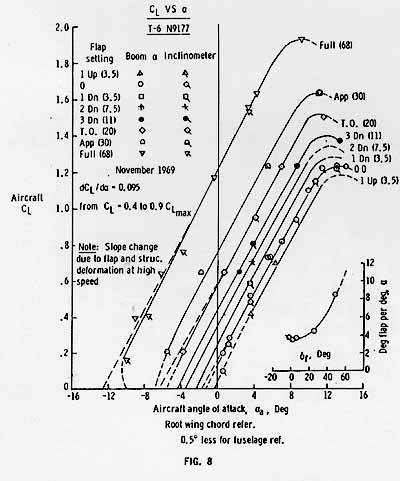
Angle of attack was also deduced from sailplane glide or dive angles measured with a sensitive inclinometer referenced to the sailplane. Corrections were made for the effect on the inclinometer of the deceleration inherent as true speed decreased with loss of altitude in constant indicated airspeed glides or dives. These were largest at the higher rates of descent. Sailplane angles were compared to measured flight-path, angles determined from rate-of-sink and speed, with, the difference being the angle of attack of the sailplane. Here again the overall accuracy appeared to be about one-half degree. Agreement between the methods was quite good within these accuracy limits, and Fig. 8 presents sufficient information to give a fairly good understanding of the angle-of-attack relationships even though the data is not as precise as we would have wished.
Lift coefficient CL and drag coefficient CD have been computed for each test point plotted in Figs. I & 2 as shown in the computation table published in an article,. Zero-flap points have, been plotted as CL2 vs CD in Fig. 9 and the flaps-down points as CL vs CD in Fig. 10. The use of these non-dimensional aerodynamic coefficients facilitates the analysis and comparison with, predicted performance and is an aid in determining the proper fairing of the curves through the test points in the various plots.
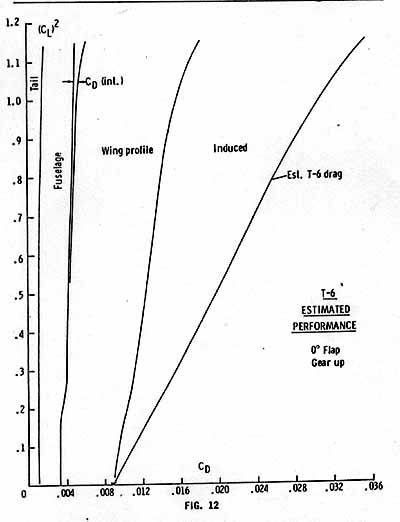
It may be of interest to look at the estimated performance of the T-6 with zero flaps. This gives a fair understanding of the contribution of drag that might be expected for the fuselage, tail, interference effects, wing profile or wake drag, and the "drag due to lift."
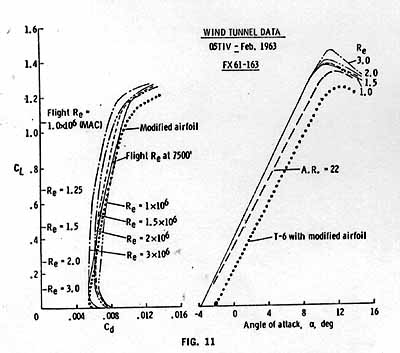
Fuselage drag was estimated from standard references using fuselage skin area, cross section, and length, as measured for the T-6. Tail-drag estimates were made in the same manner. Interference drag was also extracted from references. Wing-profile drag was taken from the published wind tunnel data for the FX61-163 airfoil as shown in Fig. 11. Note that this data is give,. in the form of CL vs CD for several Reynolds Numbers (a "scale factor" accounting for possible changes in air flow as a function of size, density of air and the true speed) Of interest to sailplane designers. Actual in-flight Reynolds Numbers for the T-6 wing are listed along the CL scale. These are for flight at 7500 ft. A CL vs CD curve for these Reynolds Numbers has been cross-plotted and shown as a solid-line curve crossing the constant Reynolds Number curves from the wind tunnel. The right side of this plot shows the CL vs angle-of-attack, a, curve as published for this two-dimensional data (infinite aspect ratio). The dash-line curve shows the computed CL vs a. relationship anticipated for the T-6 wing with a finite pan and an aspect ratio of 22. Further adjustment of the basic FX61-163 data is required to account for the trailing edge modification to the airfoil on the T-6 because of the effective reduction in camber which shifted both the angle of attack and CD relative to CL as shown by the dotted lines on Fig. 11. Finally, the "drag due to lift" was calculated, since this is a function of CL2, span, and speed, with no bearing on the basic airfoil characteristics. A span efficiency (factor to account for possible non-optimum span lift distribution), "e", of .95 was assumed.
Drag estimates are shown individually in an additive fashion with the right-hand curve representing total sailplane drag in terms of CL2 vs CD in Fig. 12 for zero flap. Comparison with the flight data in Fig. 9 shows relatively little difference which indicates that the sailplane is doing about as well as could be expected with the modified airfoil using the zero degree flap setting. In earlier times, it was commonly assumed that all drag but the drag due to lift could be expressed with a constant value of CD over much of the CL, range, and that the slope of the CL2 vs CD curve would then be a direct measure of "e" or span efficiency, This is certainly not true for the T-6 nor is it the case for other modern high performance sailplanes. For the T-6, the slope of the curve is something like, .7, but there can be no question that "e" must be close to .95 if the estimated drag values of Fig. 9 are considered.
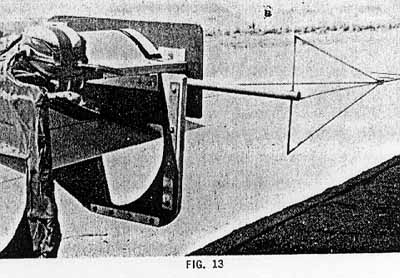
Flaps-down test data is shown in Fig. 10 as CL vs CD here there is no point in plotting CL2 because we are in a CL range where even CL2 would be nonlinear. Relative difference in drag between zero, 3.5, and 7degree down flap settings for lift coefficients around .8 to 1.0 are of particular interest here. We would reasonably expect that the 3.5-degree flap setting would approximate, the trailing edge camber of the unmodified airfoil and that the, drag might be lower in, this lift coefficient range rather than higher. Of course, Fig. 10 shows the performance of the whole sailplane and not the airfoil by itself. Tests are now in progress measuring the profile drag directly using a traversing pitot-static probe mounted behind the wing (Fig. 13) to survey the energy loss in the wing wake. Sufficient tests have already been made to show that the wake drag is reduced by five percent when 3.5 degrees of down flap are used at 45 knots (CL=.85). Obviously other effects such as a poor span-lift distribution (equivalent change in "e" of only one percent) and poor flow around the ends of the flaps more than offset the lower wake drag when the flaps are deflected.
Wake survey tests have also shown that some laminar flow does exist on the wings, at least in still air, since the drag measured on sections of the clean wing was lower than drag measured at the same stations after transition strips were added at eight percent chord to insure turbulent flow. This difference amounts to 20 percent at the higher speeds (CL=.25) and to about 10 percent at lower speeds (CL=.85). Results of the wake survey should be quite interesting when reported in detail upon completion of the tests.
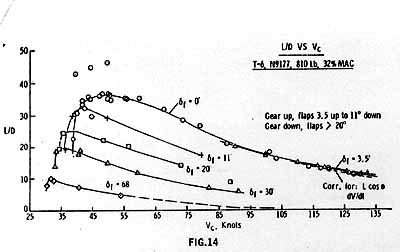
All test points have been plotted as L/D vs calibrated airspeed in Fig. 14. The performance shown here, as well as in other plots, is for flight Reynolds Numbers as shown in Fig. 11. Correction to the somewhat higher Reynolds Numbers corresponding to flight at sea level were not made because these corrections were uncertain and also because the higher altitude is more representative of the way the sailplane would be flown. It would be reasonable to expect such corrections to show as much as two or three percent less overall drag in comparing performance with wind tunnel or other sea-level derived data.
Corrections could be made for the fact that L/D is really not the same as the forward speed divided by the sinking speed. This correction would result in lower L/D performance but is insignificant for all values of L/D greater than 10. Also, corrections for the deceleration inherent with change in altitude while gliding at constant indicated airspeeds would result in somewhat lower values of L/D. Here again, the corrections would be insignificant for all normal soaring conditions being of some magnitude only at high speed and high rates of descent. In any case, the deceleration correction would only be of interest in comparing results to steady-state wind tunnel data since this deceleration always exists in gliding flight. The dash-line curve shown for zero-degree flap in Fig. 14 shows the effect of making both of these corrections which is relatively small even at the extreme high speeds used for this example.
Referring again to Fig. 14, the 30-degree flap performance shows an L/D of about 20 at 36 knots which is identical to that of a 1-26 at this speed; at 50 knots the L/D is about 15 which is representative of the performance of several two-seater training gliders. The 30-degree flap setting also provides a minimum speed of 32 knots which is within two knots of the full-flap stall speed (Fig. 7). Use of more flap, up to full flap, permits the pilot to vary his approach path from an average of about 18 with 30 degrees of flap down to something less then six with full flap.
The flap-actuation system, was designed to permit the pilot to use these capabilities in a conventional manner and at the same time provide the mechanical advantage required to keep the actuating force, at the cockpit handle to a reasonable level. A straight forward mechanical push-rod and bell-crank system was used. Cockpit controls can be seen in the photographs of Fig. 15 with the top picture showing the flap handle set for zero degrees or normal soaring flight. This handle has thumb-actuated detent release from detent positions shown for 3.5 degrees up, 0, and 3.5, 7, 11, 20 and 30 degrees down. In the center photograph, the handle has been moved aft eleven inches to the 30degree or approach flap detent. This setting is made when the pilot enters the landing pattern and the handle is not touched again until the flaps are retracted after landing. The 30-degree detent only restricts the flaps from moving to less than 30 degrees. Again in the center picture of Fig. 15, a second handle can be seen just forward of the up-flap detent, having just emerged from the guard along the forward cockpit rail. The bottom picture shows this second (speed brake) handle after it has been moved to the full flap position.
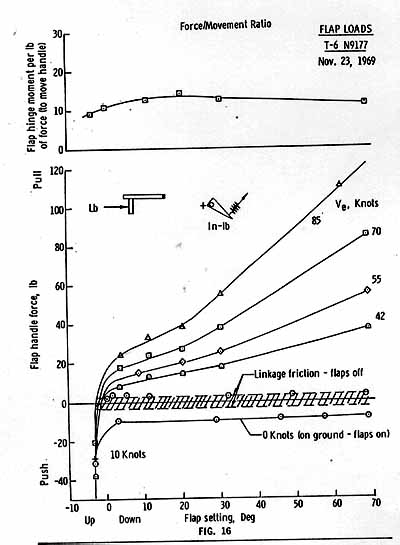
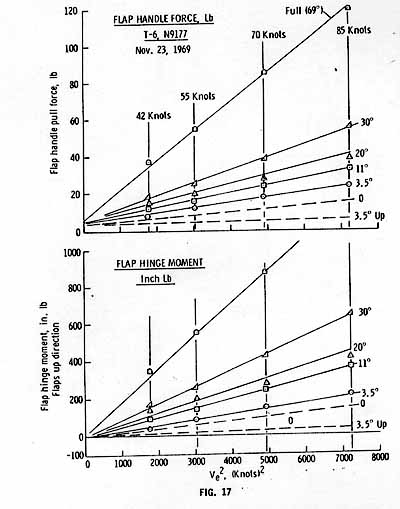
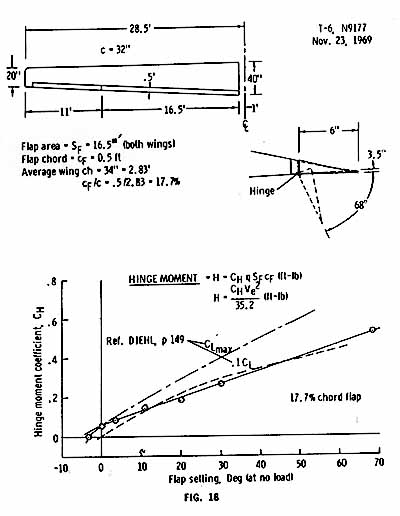
This arrangement has been eminently satisfactory and makes the approach and landing a very simple matter for the pilot. It also provides 22 inches of total travel for the cockpit control and sufficient mechanical advantage for reasonable flap handle forces in all normal operating regimes. Flap handle loads have been measured in flight and are shown as handle loads vs flap settings in Fig. 16. Forces and moments for representative flap settings are shown as a function of speed squared in Fig. 17, while hinge moments for this type of simple flap are plotted in Fig. 18. Flap deflections shown are for corresponding flap-handle settings as measured on the ground with the flaps loaded for one-G flight at 50 knots. At the higher speeds, these deflections may be a bit less because of higher loads.
Experience has shown that about 100 pounds is the maximum that the average pilot can apply to the flap handle in this particular cockpit arrangement. Full flap extension requires about 100 pounds of force at 80 knots which gives a steady dive angle of 45 degrees at this speed. Flaps may be locked down for steeper dives and the terminal velocity in a vertical dive is 115 knots which results in flying at a fuselage angle 11 degrees beyond the vertical. In these tests, the standard HP-14 flaps failed in torsion about 6 inches outboard of the root driver rib as a speed of 102 knots. Fortunately both right and left flaps failed at the same moment and in the same manner so that recovery was possible without undue rolling. The failure resulted from the buckling of the unsupported skins in the 21inch root segment of the flaps. Intermediate ribs were added to provide a 7-inch spacing in this segment. Later dives to terminal velocity (115 knots) were made without incident.
In practice there has never been an instance where there was any desire or need to use more flap then was available within the ability of the pilot to ply flaps. In numerous practice recoveries from unusual attitudes on instruments, use of flaps always results in a rapid deceleration with no problem involved in applying full flap when desired. With full flap the inherent stability of the sailplane increases markedly so that, hands off, the sailplane recovers and ends up flying indefinitely at from 45 to 55 knots with bank angles of less than 30 degrees.